Results
Welcome to the Results page.
School performance tables from the Department of Education
These figures are derived from the results of the National tests sat in May 2025.
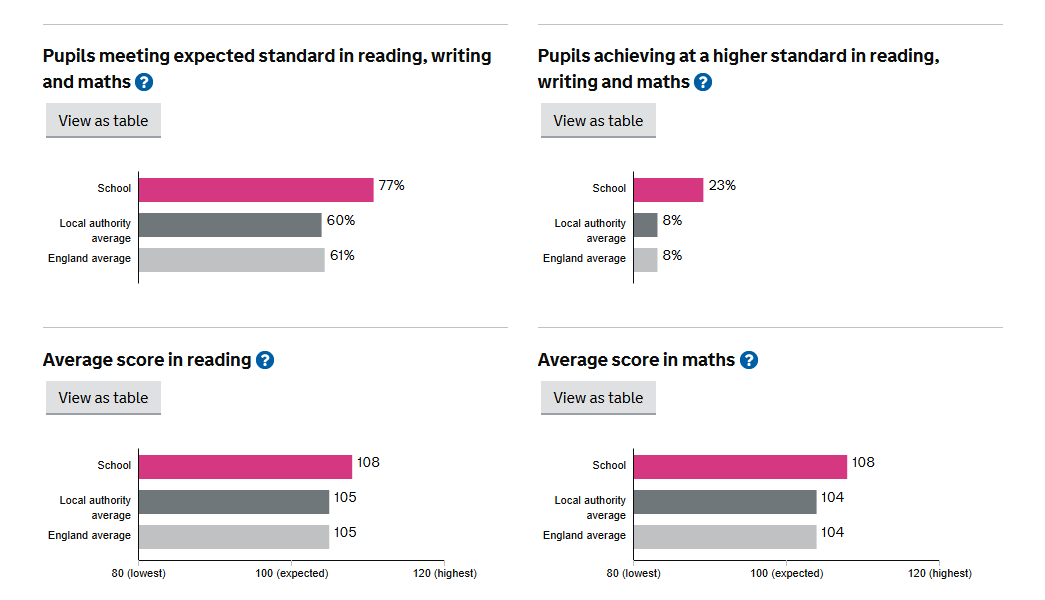
Data taken from: https://www.compare-school-performance.service.gov.uk/school/115960/wherwell-primary-school/primary
Early Years
|
EYFS Data |
GLD (Good level of development) |
Literacy goals Exp+ |
Maths goals Exp+ |
|
School % |
86% |
86% |
100% |
|
National % |
68% |
71% |
78% |
|
Local Authority % |
72% |
75% |
82% |
Year 1 Phonics Screening Check
|
Year 1 Phonics |
Result (32/40 threshold) |
|
School % (Previous YR) |
90% (95%) |
|
National % |
80% |
|
Local Authority % |
81% |
Key Stage Two
|
Year 6 Data Expected + |
Combined (R, W, M) |
Reading |
Writing |
Maths |
GPS (Grammar, Punctuation and spelling) |
|
School % (Previous Year) |
93% (77%) |
100% (100%) |
93% (77%) |
93% (92%) |
93% (92%) |
|
National % |
62% |
75% |
72% |
74% |
73% |
|
Local Authority % Provisional |
61% |
75% |
72% |
74% |
71% |
|
Year 6 Data GDS |
Combined (R, W, M) |
Reading |
Writing |
Maths |
GPS (Grammar, Punctuation and spelling) |
|
School % (Previous Year) |
14% (23%) |
64% (39%) |
21% (31%) |
29% (39%) |
57% (31%) |
|
National % |
8% |
33% |
13% |
26% |
30% |
|
Local Authority % Provisional |
8% |
34% |
14% |
25% |
27% |
Department of Education school performance tables website
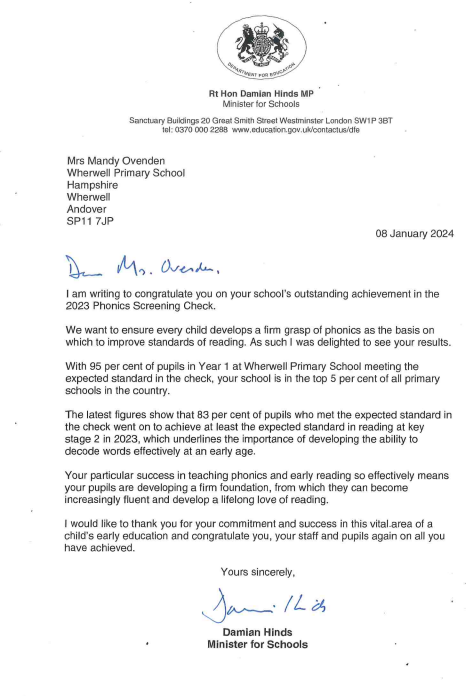
Phonics 2022/2023
Wherwell scored in the top 5% of schools in the country in the 2023 phonics screening check. We were pleased to also receive a letter from the minister of education.